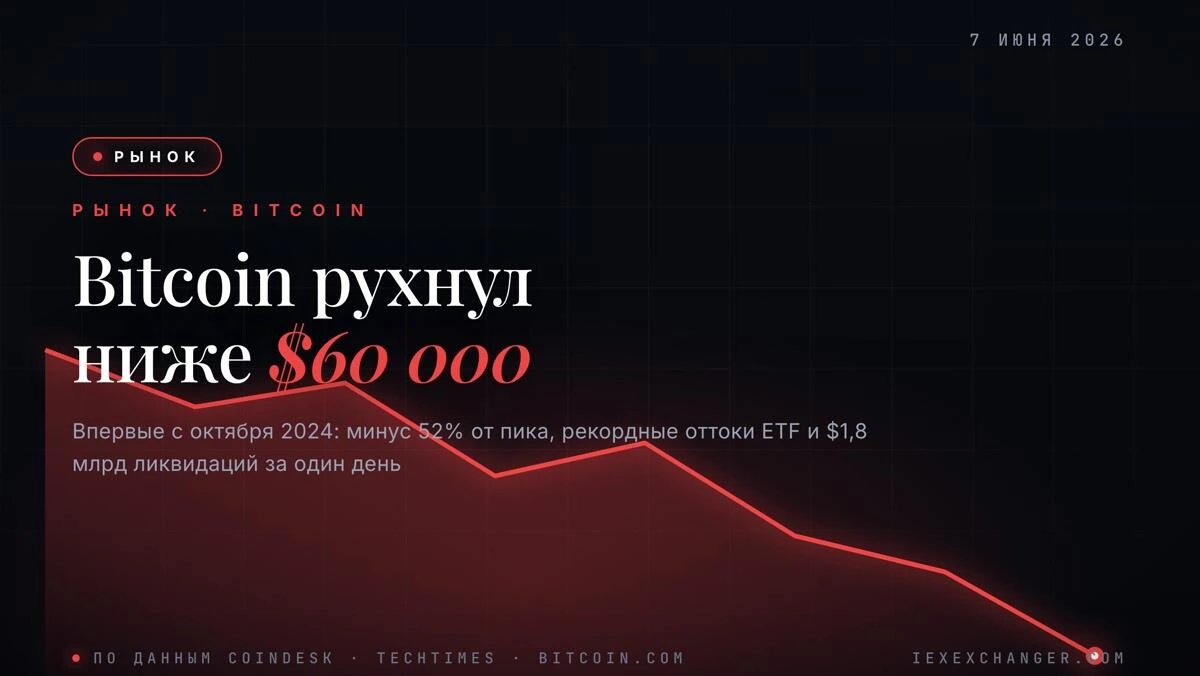
Seven months ago, Bitcoin was trading above $126,000. On June 5, it hit $59,100 — its lowest level since October 2024. The fall through $60,000 erased every gain accumulated during the last bull cycle, with the weekly loss clocking in at nearly 20% and the drawdown from the peak exceeding 52%.
The selling pressure didn't come from a single catalyst. Spot Bitcoin ETFs recorded their 13th consecutive day of outflows on June 5, draining a cumulative $4.4 billion — a record streak that flipped 2026's total ETF flows negative for the first time since these products launched. When funds bleed assets, managers sell real coins on the open market. The sustained scale of this run was almost without precedent in the ETF era.
Strategy's 32-bitcoin sale rattled sentiment further. Small in absolute terms, it was the company's first bitcoin disposal since 2022 — and Strategy had become synonymous with never selling. Michael Saylor publicly called the broader selloff an "AI rotation," arguing that institutional capital is chasing AI infrastructure at historic scale: roughly $400 billion deployed in six months. Strategy itself now sits on approximately $10.8 billion in unrealized losses at an average cost basis near $75,500.
The market's response was swift. One session saw $1.8 billion in leveraged positions liquidated — $1.35 billion of that from long bets. The broader crypto market lost around $390 billion in market cap over the week. Macro headwinds compounded the pressure: rate expectations have shifted from cuts toward a potential hike after inflation stayed sticky and jobs data came in strong.
By June 7, Bitcoin had climbed back to around $61,800. RSI-14 touched 24 — deeply oversold territory that has historically preceded bounces — and hourly charts showed a sequence of higher lows forming. A sustained close above $63,000–64,000 would challenge the bearish daily trend. Until then, three forces remain in play: macro headwinds, ongoing capital rotation into AI, and lingering uncertainty around potential Mt. Gox bitcoin distributions.